Dashboard Chart Add-on
This add-on provides an additional Chart widget for the Dashboards add-on. The Chart widget is based on a report that has a template with the Chart output type.
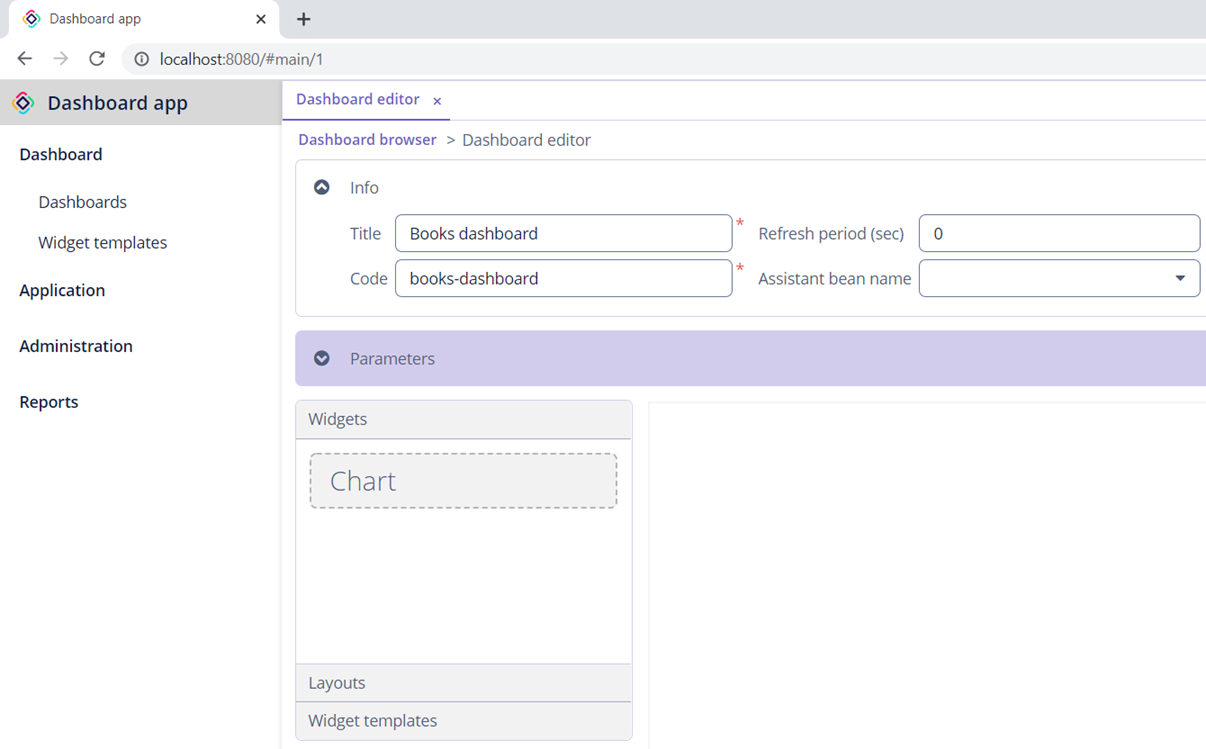
Using in Dashboard
After the Dashboard Chart add-on is added to the application, a new Chart widget appears in the Dashboard editor screen.
Move the Chart widget to the canvas. In the Widget editor dialog, select a report. Only reports with a chart output will be displayed in the list.
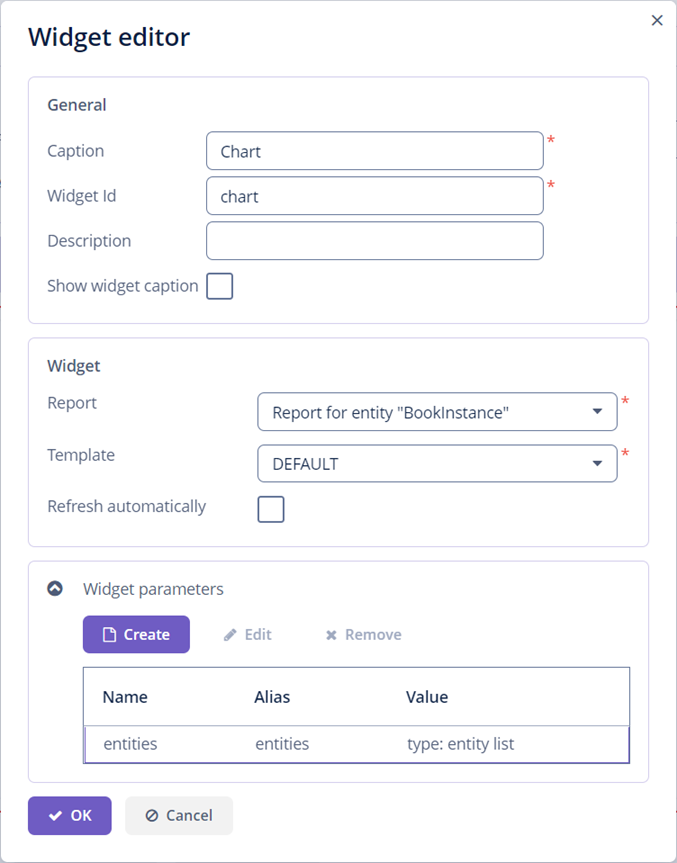
To update the chart automatically on a dashboard update, select the Refresh automatically checkbox.
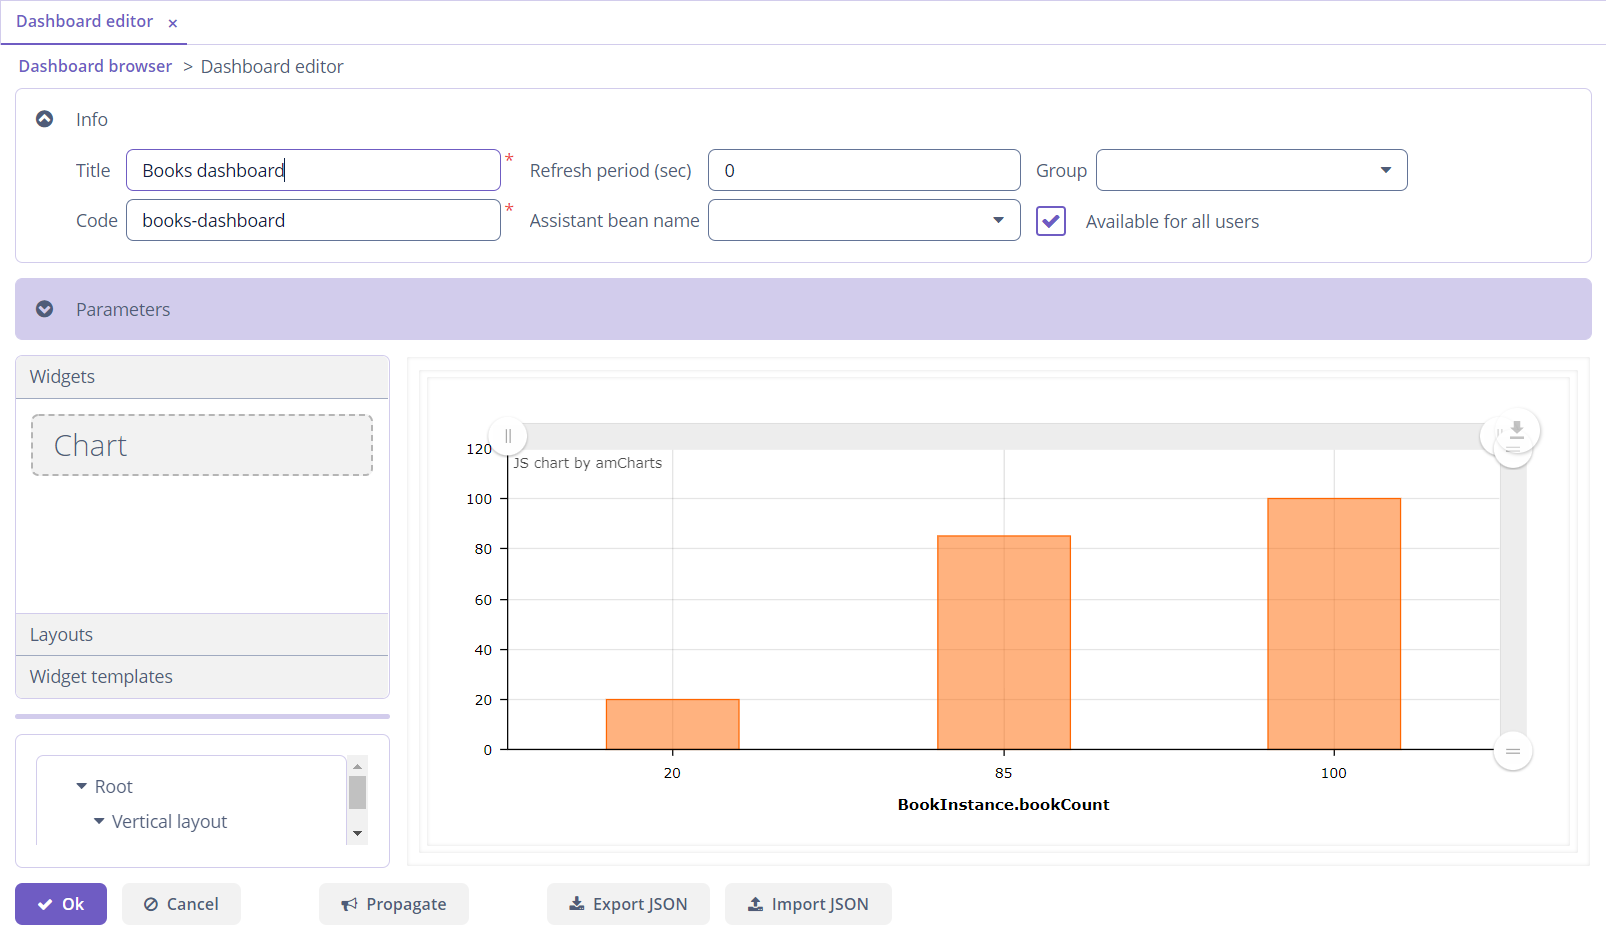
Here is an example of displaying a chart in a dashboard:
| For successful execution of the report the chart widget is based on, be sure you granted user access to entities used in the report. |