AngularGaugeChart
The AngularGaugeChart component allows you to create gauge charts.
Component’s XML name: chart:gaugeChart
Elements
-
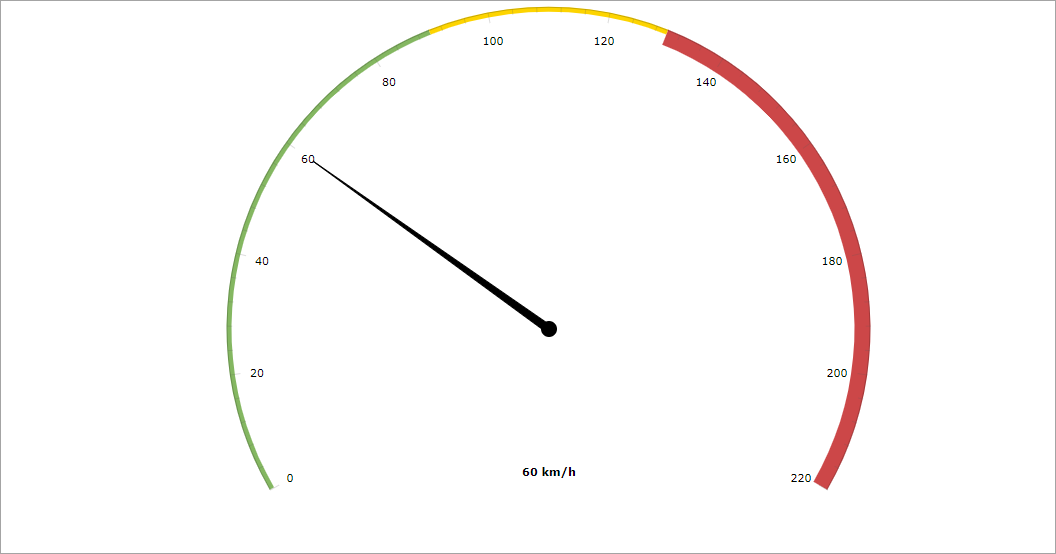
arrows- includes the nestedarrowelements for the chart arrow axes.<chart:arrows> <chart:arrow value="60"/> </chart:arrows> -
axes- includes the nestedaxiselements for the chart axes.<chart:axes> <chart:axis axisAlpha="0.2" axisThickness="1" bottomText="60 km/h" bottomTextYOffset="-20" endValue="220" tickAlpha="0.2" valueInterval="20"> </chart:axis> </chart:axes>The
bandelement enables you to split an axis into several bands (as in the picture above):<chart:axes> <chart:axis axisAlpha="0.2" axisThickness="1" bottomText="60 km/h" bottomTextYOffset="-20" endValue="220" tickAlpha="0.2" valueInterval="20"> <chart:bands> <chart:band color="#84b761" endValue="90" startValue="0"/> <chart:band color="#fdd400" endValue="130" startValue="90"/> <chart:band color="#cc4748" endValue="220" innerRadius="95%" startValue="130"/> </chart:bands> </chart:axis> </chart:axes>The
endValueandstartValueattributes are used to set the range of values on the chart, thevalueIntervalattribute defines the gauge scale marks.
Events and Handlers
|
Чтобы сгенерировать заглушку слушателя в Jmix Studio, выберите компонент в XML-дескрипторе экрана или на панели иерархии Jmix UI и используйте вкладку Handlers на панели инспектора Jmix UI. В качестве альтернативы вы можете воспользоваться кнопкой Generate Handler на верхней панели контроллера экрана. |
For more details, see AmCharts documentation.