XYChart
The XYChart component allows you to create XY/bubble/scatter charts. The charts support multiple axes with simple or logarithmic scales.
XYChart
Component’s XML name: chart:xyChart.
Data Binding
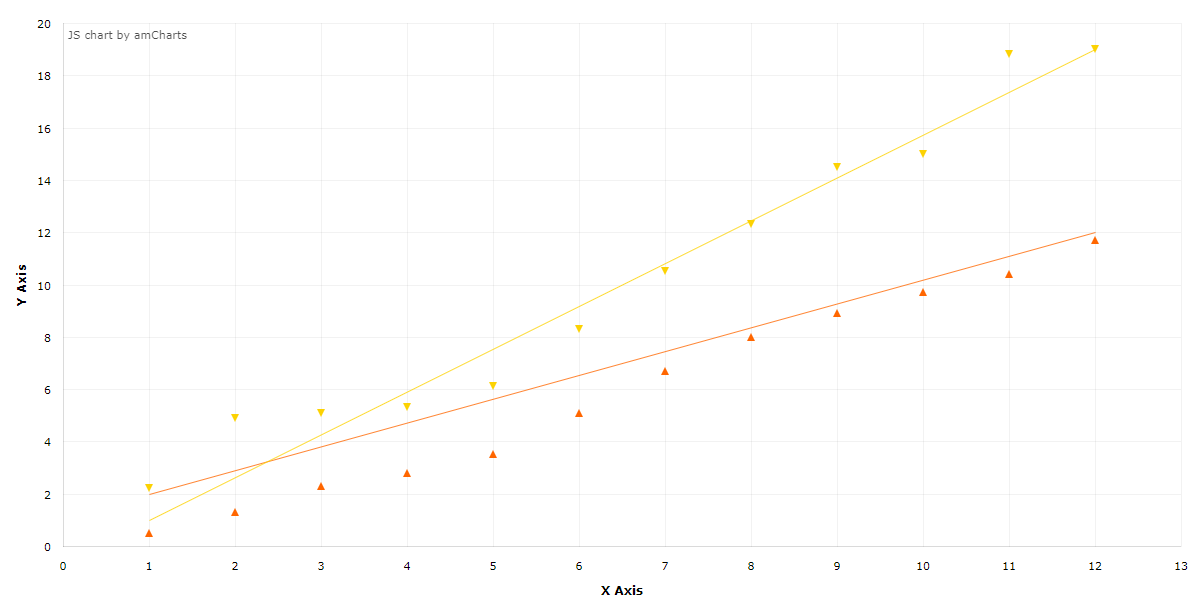
You can assign a CollectionContainer to the chart and then define the xField and yFields attributes for the nested graph elements:
<chart:xyChart id="xyChart"
               autoMarginOffset="20"
               dataContainer="pointPairDc"
               height="100%"
               marginBottom="60"
               marginLeft="64"
               startDuration="1"
               theme="LIGHT"
               width="100%">
    <chart:graphs>
        <chart:graph balloonText="x:[[x]] y:[[y]]"
                     bullet="TRIANGLE_UP"
                     fillAlphas="0"
                     lineAlpha="0"
                     lineColor="#FF6600"
                     xField="ax"
                     yField="ay"/>
        <chart:graph balloonText="x:[[x]] y:[[y]]"
                     bullet="TRIANGLE_DOWN"
                     fillAlphas="0"
                     lineAlpha="0"
                     lineColor="#FCD202"
                     xField="bx"
                     yField="by"/>
    </chart:graphs>
    <chart:valueAxes>
        <chart:axis axisAlpha="0"
                    dashLength="1"
                    position="BOTTOM"
                    title="X Axis"/>
        <chart:axis axisAlpha="0"
                    dashLength="1"
                    position="LEFT"
                    title="Y Axis"/>
    </chart:valueAxes>
</chart:xyChart>
Events and Handlers
|
Чтобы сгенерировать заглушку слушателя в Jmix Studio, выберите компонент в XML-дескрипторе экрана или на панели иерархии Jmix UI и используйте вкладку Handlers на панели инспектора Jmix UI. В качестве альтернативы вы можете воспользоваться кнопкой Generate Handler на верхней панели контроллера экрана. |
For more details, see AmCharts documentation.