GanttChart
The GanttChart component allows you to create Gantt charts.
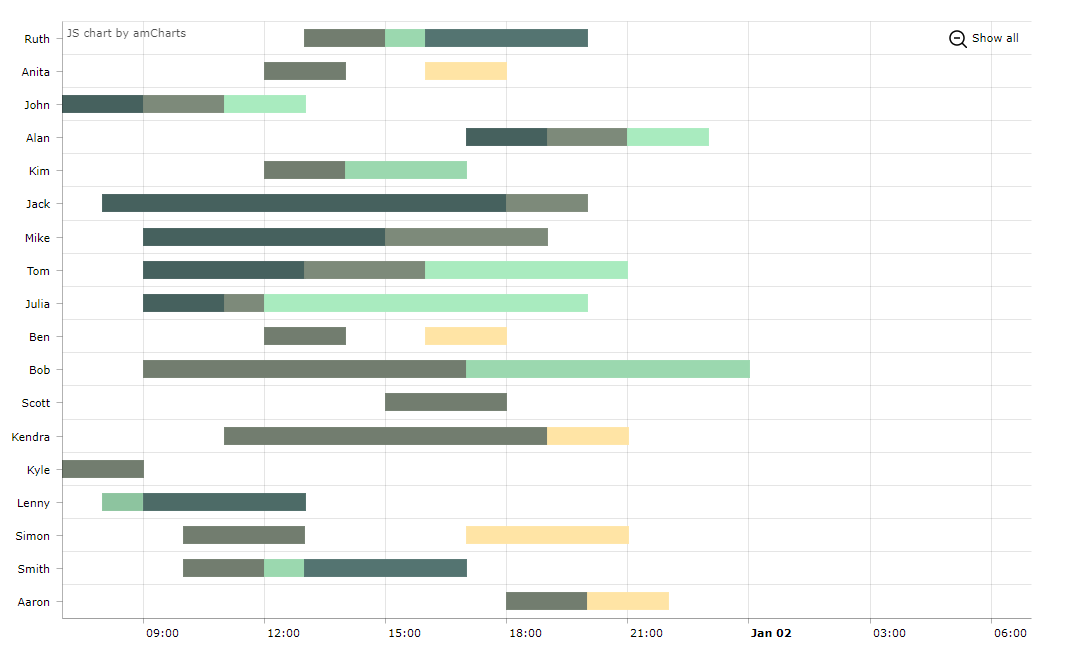
Component’s XML name: chart:ganttChart.
Elements
-
categoryAxis– an element that describes the category axis. -
graph– an element that contains a collection ofchart:graphelements; the graph is described by thechart:graphelement.-
the
typeattribute defines the type of the graph and can be: line, column, step line, smoothed line, OHLC, and candlestick. -
the
valueFieldattribute defines a key from the list of key-value pairs of data provider.
-
-
valueAxis– a value axis of the chart. If the chart data is date- or time-based, you can set the value axis type todate.
Attributes
-
segmentsField– a segments field of the chart. -
additionalSegmentFields– a list of additional segment fields that correspond to the entity attributes to be fetched from the data provider, similarly to the additionalFields attribute. -
endField/endDateField– an end value or the end date of the chart. -
startField/startDateField– a start value or the start date of the chart. -
startDate– a chart start date if the value axis type is adate. -
categoryField– a category field of the chart.
Data Binding
You can assign a CollectionContainer to the chart. In the example below the start and end attributes of an entity are set for the attributes startDateField and endDateField.
<chart:ganttChart id="ganttChart"
additionalSegmentFields="task"
balloonDateFormat="JJ:NN"
brightnessStep="10"
categoryField="category"
colorField="color"
columnWidth="0.5"
dataContainer="taskSpansDc"
durationField="duration"
height="100%"
marginRight="70"
period="HOURS"
rotate="true"
segmentsField="segments"
startDate="2022-01-01"
startField="start"
theme="LIGHT"
width="100%">
<chart:graph balloonText="<strong>[[task]]</strong>: [[open]] [[value]]"
fillAlphas="1"/>
<chart:valueAxis maximum="31"
minimum="7"
type="DATE"/>
<chart:chartCursor cursorAlpha="0"
cursorColor="#55bb76"
fullWidth="true"
valueLineAlpha="0.5"
valueBalloonsEnabled="false"
valueLineBalloonEnabled="true"
valueLineEnabled="true"
valueZoomable="true"
zoomable="false"/>
</chart:ganttChart>Events and Handlers
|
Чтобы сгенерировать заглушку слушателя в Jmix Studio, выберите компонент в XML-дескрипторе экрана или на панели иерархии Jmix UI и используйте вкладку Handlers на панели инспектора Jmix UI. В качестве альтернативы вы можете воспользоваться кнопкой Generate Handler на верхней панели контроллера экрана. |
For more details, see AmCharts documentation.