SerialChart
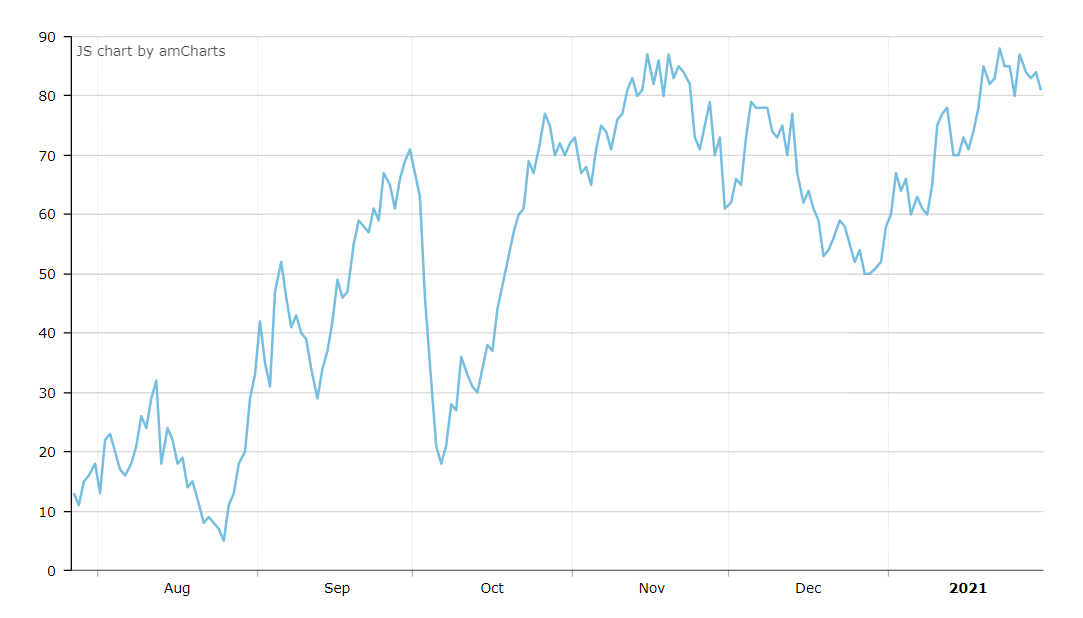
The SerialChart component allows you to create line, area, column, bar, step line, smoothed line, candlestick, and OHLC charts. The charts support multiple axes with simple or logarithmic scales. The data points can be displayed at equal/irregular intervals or on a timeline basis.
Component’s XML name: chart:serialChart.
Data Binding
You can assign a CollectionContainer to the chart and then define the categoryField attribute for the serialChart element and valueField attribute for the nested graph element:
<chart:serialChart id="lineChart"
autoMarginOffset="20"
categoryField="date"
dataContainer="dateValueDc"
height="100%"
marginRight="40"
marginLeft="40"
mouseWheelZoomEnabled="true"
theme="LIGHT"
width="100%">
<chart:graphs>
<chart:graph id="g1"
bullet="ROUND"
bulletBorderAlpha="1"
bulletColor="WHITE"
bulletSize="5"
hideBulletsCount="50"
lineThickness="2"
title="Red line"
useLineColorForBulletBorder="true"
valueField="value"
balloonText="<span style='font-size:18px;'>[[value]]</span>">
<chart:balloon adjustBorderColor="false"
color="WHITE"
drop="true"/>
</chart:graph>
</chart:graphs>
<chart:categoryAxis dashLength="1"
minorGridEnabled="true"/>
</chart:serialChart>Events and Handlers
|
Чтобы сгенерировать заглушку слушателя в Jmix Studio, выберите компонент в XML-дескрипторе экрана или на панели иерархии Jmix UI и используйте вкладку Handlers на панели инспектора Jmix UI. В качестве альтернативы вы можете воспользоваться кнопкой Generate Handler на верхней панели контроллера экрана. |
For more details, see AmCharts documentation.